
Build a Tile-Based Google Map with JavaScript
Ever wondered how Google Maps loads and zooms so smoothly? While their full system is massively complex, the fundamental idea behind map display is surprisingly approachable.
In this post, we'll walk through the process of building a very basic tile-based map display library - just enough to understand how tiled maps work, including zoom and pan behavior.
Introducing the Tile System
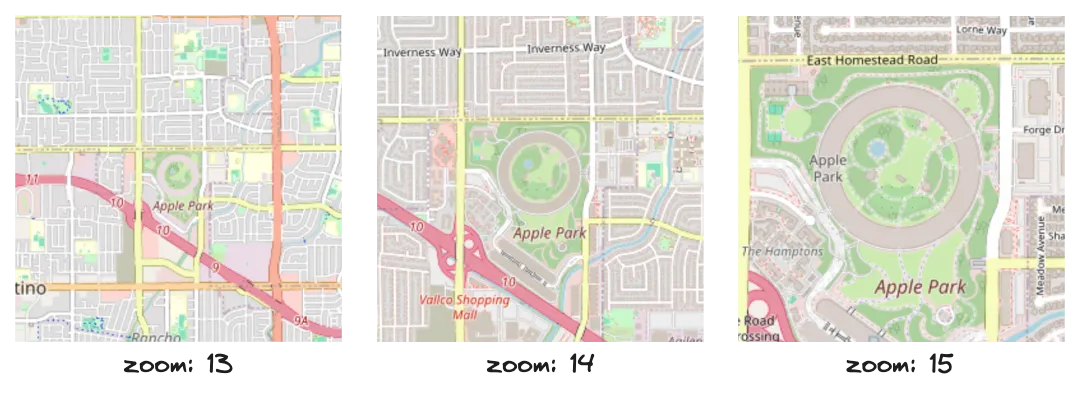
Modern web-based maps like Google Maps and OpenStreetMap use a tile-based system to display the world at various zoom levels. The core concept is simple:
- The map is split into square tiles, usually 256×256 pixels.
- At zoom level 0, the entire world fits into one tile.
- Each higher zoom level doubles the resolution, making the grid size 2ⁿ × 2ⁿ tiles.
- These tiles are pre-rendered images and fetched dynamically based on the user's view.
This approach allows for efficient loading, smooth panning, and zooming at different scales. The URL format for a tile is:
https://tile.openstreetmap.org/{z}/{x}/{y}.png
Where:
zis the zoom levelxandyare the tile column and row indexes at that zoom level
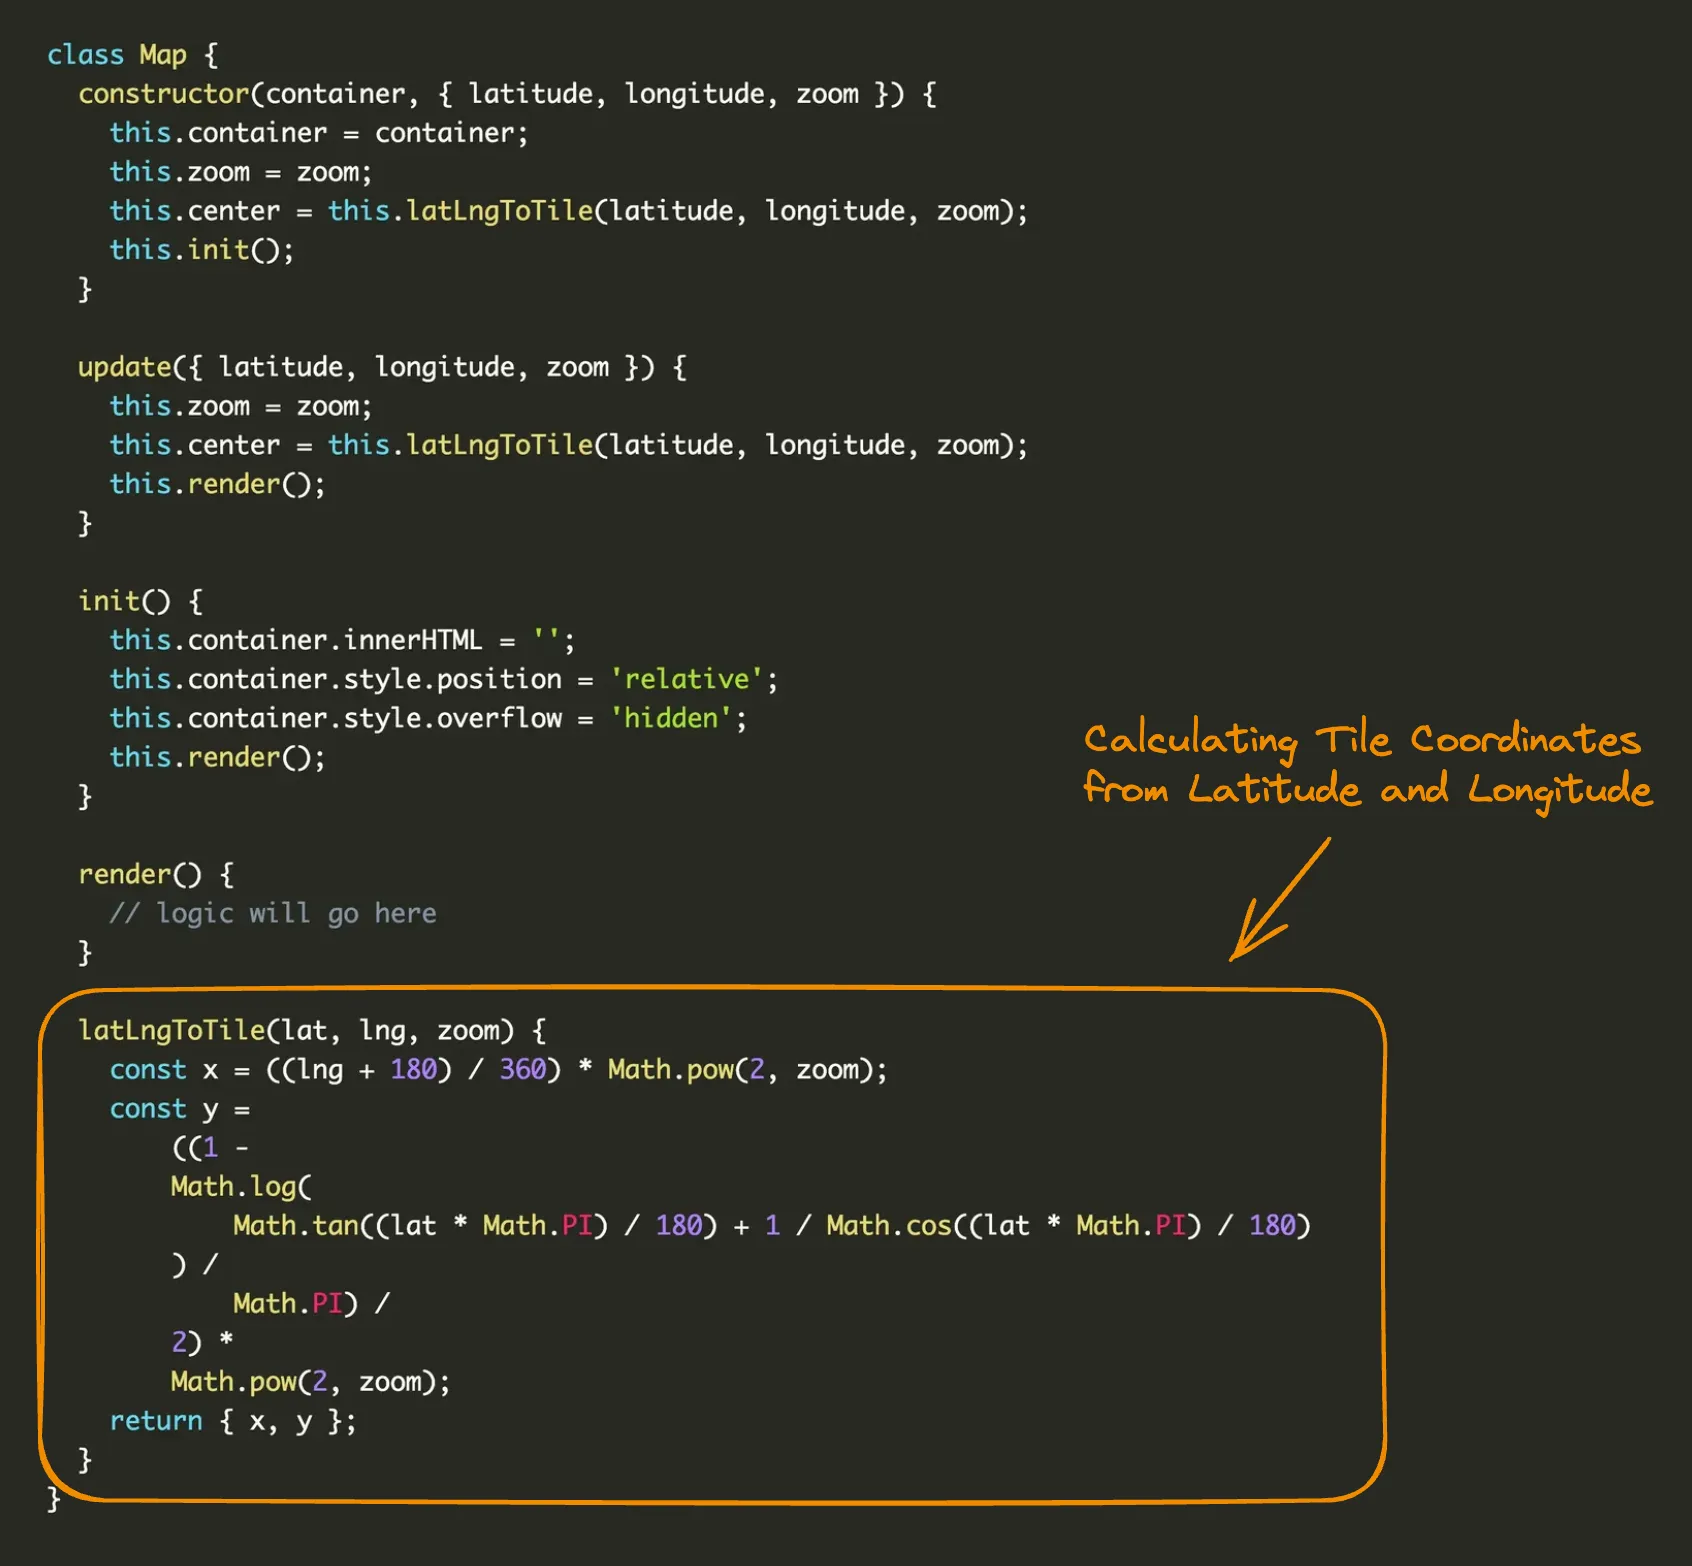
Calculating Tile Coordinates from Latitude and Longitude
To display a map centered at a specific location, we need to convert geographic coordinates (latitude and longitude) into tile coordinates.
Here's how it's done using the Web Mercator projection:
function latLngToTile(lat, lng, zoom) {
  const x = ((lng + 180) / 360) * Math.pow(2, zoom);
  const y =
    ((1 -
      Math.log(
        Math.tan((lat * Math.PI) / 180) + 1 / Math.cos((lat * Math.PI) / 180)
      ) /
        Math.PI) /
      2) *
    Math.pow(2, zoom);
  return { x, y };
}
This gives you a floating-point tile coordinate. For rendering, you typically round or floor these values to get the tile index.
Building a Reusable Map Library
Now that we understand how the tile system works and how to convert latitude/longitude to tile coordinates, let’s turn that knowledge into a simple, reusable JavaScript library.
Our goal is to display a slippy map on any web page using a minimal API:
// Initialize the map
const map = new Map(document.body, {
  latitude: 25.033,
  longitude: 121.565,
  zoom: 12
});

// Update the map position
map.update({
  latitude: 24.998,
  longitude: 121.543,
  zoom: 14
});
This API gives you an easy way to embed an interactive, zoomable map into any container element.
Internally, the Map class will:
- Convert lat/lng to tile coordinates
- Compute and render the visible tiles based on zoom and container size
- Handle panning and zoom in/out with controls
- Support dynamic updates via the
update()method
Let’s break down how this works in code.
Prepare the Playground
Let’s start with a minimal HTML setup where we’ll display our map. You can use this as a base to test the library.
<!DOCTYPE html>
<html>
  <body>
    <div id="map" style="width: 100vw; height: 100vh;"></div>
    <script src="map.js"></script>
    <script>
      const map = new Map(document.getElementById('map'), {
        latitude: 25.033,
        longitude: 121.565,
        zoom: 12
      });
    </script>
  </body>
</html>
This template does the following:
- Defines a
div#mapelement where the tiles will be rendered - Loads the
map.jsscript containing your map logic - Initializes the map with a specific latitude, longitude, and zoom level
Step-by-Step: Implementing the Map Library
Step 1: Create the Map Class Skeleton
Start by defining the class and storing references to the container and initial state:
Step 2: Calculate Visible Tile Range
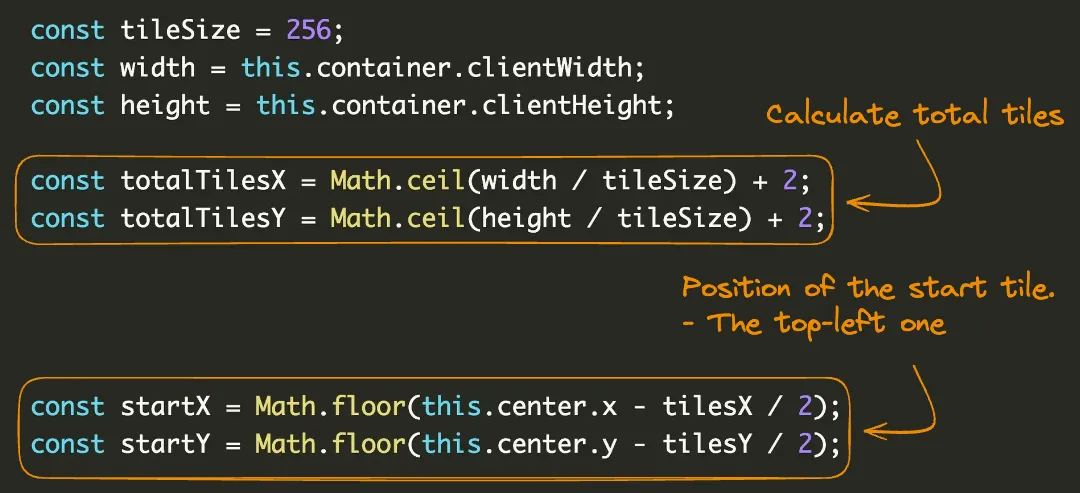
To render tiles, we first determine the visible area in tile coordinates. This helps us know which tiles to load based on the viewport size and zoom level.
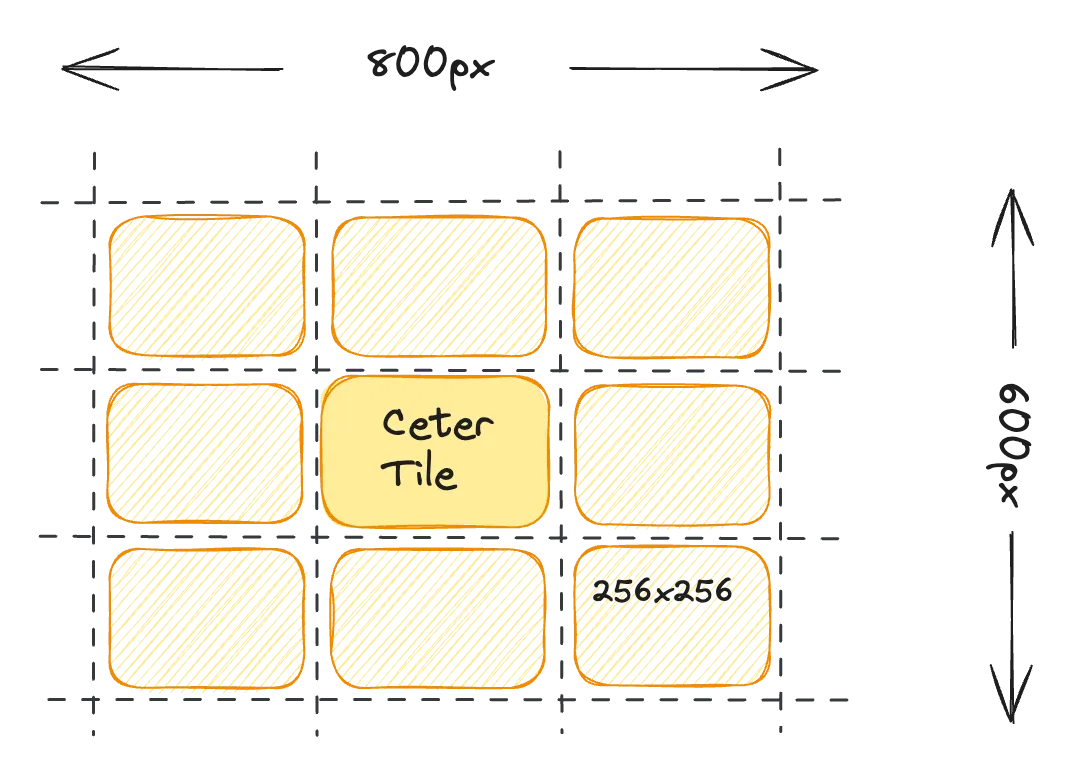
For example, suppose the map container is 800 pixels wide and 600 pixels tall. Since each tile is 256 pixels square, the map would need about 3.1 tiles horizontally and 2.3 tiles vertically to fill the screen. To ensure full coverage and avoid any gaps during panning, we round up these values and add a small buffer - typically 2 extra tiles - resulting in a total of 5 tiles across and 5 tiles down. The map will then begin rendering tiles starting from a calculated top-left position and cover a 5×5 grid around the center.
Here’s what that looks like in code:
Step 3: Load and Position Tiles
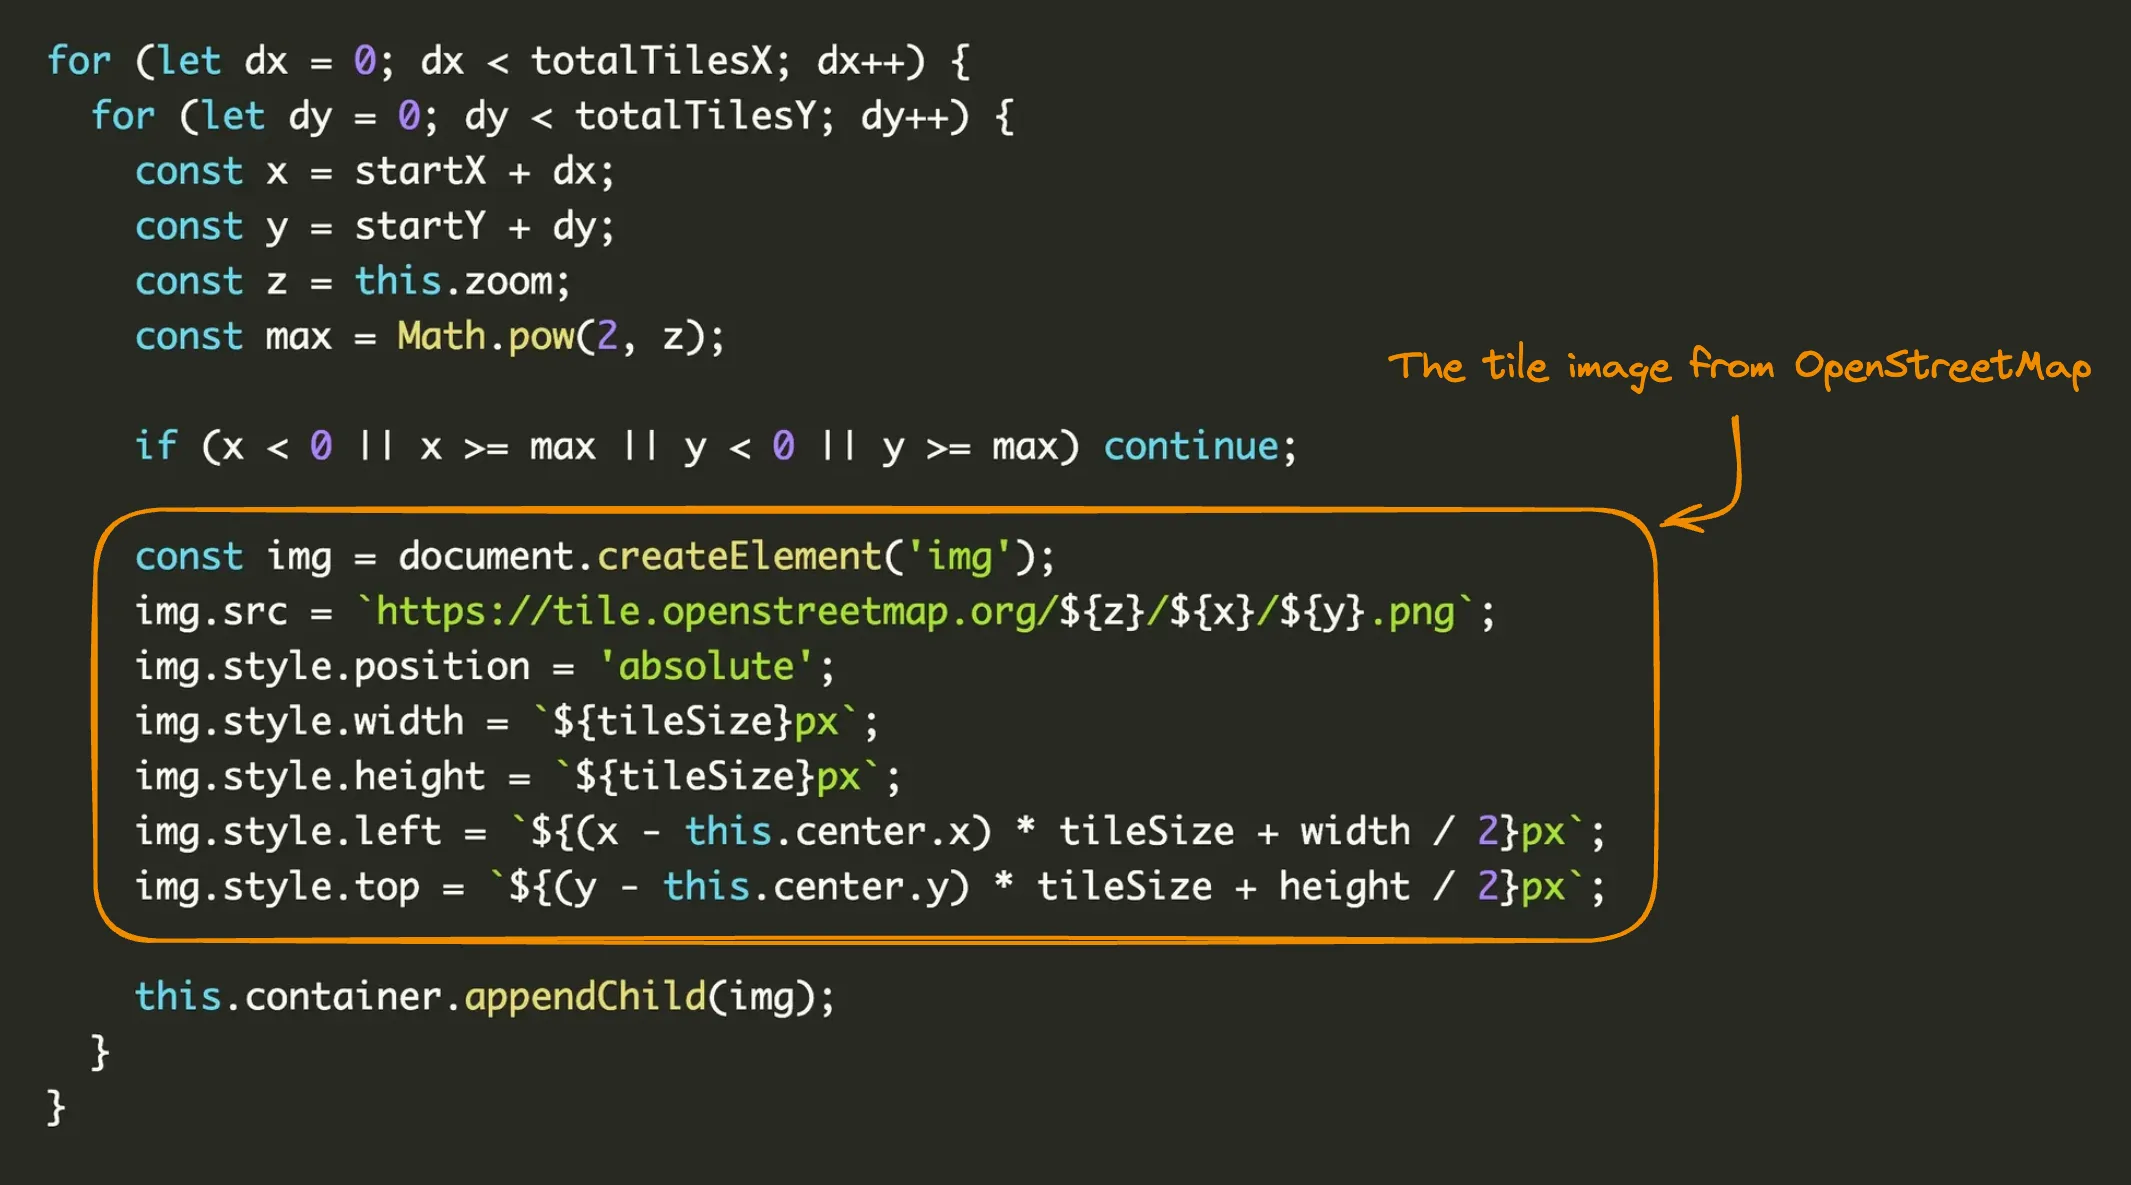
Loop through the visible tile range and create an image for each tile. Each image represents a single map tile and is placed inside the container.
We use position: absolute for each tile so that we can control its exact placement using pixel coordinates. This ensures that every tile can be positioned precisely within the container without being affected by the layout of other elements. By calculating each tile’s offset relative to the center of the map view, we can align the tiles into a seamless grid no matter how the user pans or zooms the map.
Here’s a simplified version of the logic:
Step 4: Add Zoom Buttons
To zoom in or out, we adjust the zoom level and scale the center tile coordinates accordingly. This ensures the map stays centered around the same point.
zoomIn() {
  if (this.zoom < 19) {
    this.center.x *= 2;
    this.center.y *= 2;
    this.zoom++;
    this.render();
  }
}

zoomOut() {
  if (this.zoom > 0) {
    this.center.x /= 2;
    this.center.y /= 2;
    this.zoom--;
    this.render();
  }
}
You can call these methods from UI buttons to give users zoom control.
Conclusion
What we've built here is a foundational map rendering engine that mimics the core mechanics behind many real-world mapping tools. By understanding how tiles work, how to calculate their positions based on latitude, longitude, and zoom levels, and how to dynamically render them in the browser, you've gained insight into the architecture of interactive web maps.
While this library is basic, it covers essential concepts like coordinate conversion, viewport calculations, and zoom behavior. These are exactly the kinds of primitives that libraries like Leaflet and MapLibre build upon - only with added complexity, interactivity, and performance optimizations.
From here, you're equipped to continue expanding your implementation. Whether you want to add panning inertia, touch gestures, custom overlays, or even vector tile rendering, the foundation is set. Most importantly, you now understand how it all fits together.